From Data to Decisions: How Analytics & Reporting Drive Business Growth
In today’s competitive business environment, data has become one of the most valuable resources for organizations of every size. Businesses generate enormous amounts of information through websites, customer interactions, sales transactions, social media, marketing campaigns, applications, and internal operations. However, collecting data alone does not guarantee business success. The real value comes from understanding that data and converting it into meaningful insights.
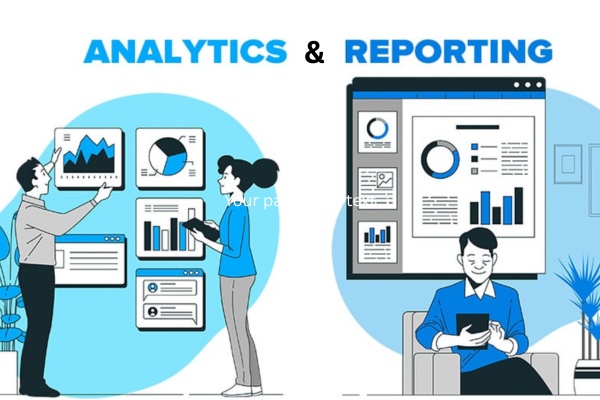
This is where Analytics & Reporting play an important role. Analytics helps businesses examine data, identify patterns, measure performance, and understand what is happening across different areas of the organization. Reporting transforms these findings into structured information that decision-makers can easily understand and use.
From improving customer experiences to reducing operational costs and identifying new opportunities, analytics and reporting can support better business decisions at every level.
What Are Analytics and Reporting?
Analytics refers to the process of examining data to discover meaningful patterns, trends, relationships, and insights. It helps organizations answer questions such as:
- What is happening in the business?
- Why is it happening?
- What factors are affecting performance?
- What could happen in the future?
- What actions should the business take?
Reporting focuses on presenting business information in a clear and organized format. Reports can include tables, charts, graphs, dashboards, KPIs, and performance summaries.
For example, a sales report may show monthly revenue, product performance, customer segments, and regional sales. Analytics can then help determine why one product is performing better than another and identify opportunities for improvement.
Together, analytics and reporting create a bridge between raw data and informed business decisions.
Why Data-Driven Decision-Making Matters
Traditional business decisions often depend on experience, assumptions, or limited information. While experience remains valuable, modern businesses can make decisions more effectively when they combine expertise with reliable data.
Data-driven decision-making allows organizations to evaluate actual business performance rather than relying entirely on assumptions.
For example, instead of asking, “Why are sales declining?” a company can analyze:
- Sales trends over different periods
- Customer purchasing behavior
- Product-level performance
- Marketing campaign results
- Website traffic and conversions
- Geographic performance
- Customer retention rates
- Pricing changes
This provides decision-makers with a more detailed understanding of the situation and helps them determine where action may be required.
How Analytics Turns Raw Data Into Business Insights
Raw data by itself can be difficult to understand. A spreadsheet containing thousands of transactions may contain valuable information, but identifying important patterns manually can take considerable time.
Analytics transforms raw information into actionable insights through several stages.
1. Data Collection
The first step is gathering relevant information from different sources. Depending on the organization, data may come from:
- CRM systems
- Sales platforms
- Websites
- Mobile applications
- Social media
- Marketing platforms
- Financial systems
- Customer support systems
- Inventory management software
- Business databases
The quality and relevance of collected data have a major impact on the quality of the resulting analysis.
2. Data Cleaning
Business data may contain duplicate records, missing values, incorrect entries, inconsistent formats, or outdated information.
Data cleaning helps improve reliability by identifying and correcting these issues before analysis.
Clean data helps organizations reduce errors and build more trustworthy reports and dashboards.
3. Data Analysis
Once the data is prepared, analysts can examine it to identify trends, relationships, and performance indicators.
For example, a company may discover that:
- Certain products generate higher margins.
- A specific customer segment has higher retention.
- Website traffic increases after particular campaigns.
- Sales decline during specific periods.
- Certain regions consistently outperform others.
These insights can provide a stronger foundation for strategic decisions.
4. Data Visualization
Charts, dashboards, graphs, and interactive reports make complex information easier to understand.
Instead of reviewing thousands of rows in a spreadsheet, business leaders can view important metrics through visual dashboards.
Visualization can make it easier to identify:
- Trends
- Outliers
- Growth patterns
- Performance gaps
- Opportunities
- Risks
5. Decision-Making
The final step is turning insights into action.
Analytics becomes valuable when businesses use the information to make practical decisions such as changing marketing strategies, improving products, optimizing operations, adjusting inventory, or focusing on high-value customer segments.
The Role of Reporting in Business Growth
Reporting provides organizations with a structured way to monitor performance.
A well-designed report can help different teams understand the information relevant to their responsibilities.
For example:
Sales teams can monitor revenue, conversions, leads, and sales targets.
Marketing teams can evaluate campaign performance, traffic, engagement, leads, and customer acquisition.
Finance teams can track revenue, expenses, profitability, and financial trends.
Operations teams can monitor productivity, inventory, delivery times, and resource utilization.
Management teams can review high-level KPIs and organizational performance.
This makes reporting an important part of organizational communication and performance management.
Key Types of Business Analytics
Businesses can use different forms of analytics depending on the questions they need to answer.
Descriptive Analytics
Descriptive analytics focuses on understanding what has already happened.
Examples include:
- Monthly sales reports
- Website traffic reports
- Revenue dashboards
- Customer acquisition reports
- Employee performance summaries
It provides a clear view of historical and current performance.
Diagnostic Analytics
Diagnostic analytics focuses on understanding why something happened.
For example, if sales declined during a particular month, diagnostic analysis may examine customer behavior, product availability, pricing, marketing campaigns, and regional trends to identify possible causes.
Predictive Analytics
Predictive analytics uses historical and current data to identify potential future outcomes.
Organizations can use predictive approaches for:
- Demand forecasting
- Customer churn analysis
- Sales forecasting
- Risk assessment
- Inventory planning
- Customer behavior prediction
Predictions are not guarantees, but they can provide useful information for planning and preparation.
Prescriptive Analytics
Prescriptive analytics goes further by exploring possible actions based on available information.
It can help businesses evaluate different scenarios and determine which actions may produce desirable outcomes.
This can support areas such as pricing, resource allocation, marketing optimization, and supply-chain planning.
How Analytics & Reporting Drive Business Growth
1. Better Business Decisions
One of the biggest benefits of analytics is improved decision-making.
When decision-makers have access to accurate and timely information, they can evaluate situations more effectively and identify potential opportunities or challenges.
Instead of making decisions based only on assumptions, businesses can use measurable evidence to support their strategies.
2. Improved Customer Understanding
Customer data can reveal important information about preferences, behavior, purchasing patterns, and engagement.
Analytics can help businesses understand:
- Which products customers prefer
- How customers interact with a website
- Which campaigns generate engagement
- Why customers leave
- Which customer segments are most valuable
This information can support better customer experiences and more targeted strategies.
3. Increased Operational Efficiency
Analytics can reveal inefficiencies within business processes.
For example, organizations can analyze:
- Production times
- Delivery delays
- Inventory levels
- Employee productivity
- Resource utilization
- Process bottlenecks
Identifying these issues allows businesses to optimize operations and use resources more effectively.
4. Improved Marketing Performance
Marketing teams generate large volumes of data from advertising platforms, search engines, social media, email campaigns, and websites.
Analytics can help determine which channels and campaigns are delivering meaningful results.
Businesses can monitor metrics such as:
- Click-through rate
- Conversion rate
- Cost per lead
- Customer acquisition cost
- Return on advertising spend
- Website engagement
- Lead generation
This enables marketing teams to make more informed campaign decisions.
5. Revenue Growth
Analytics can identify products, customers, markets, and channels that contribute significantly to revenue.
Businesses can use this information to identify growth opportunities and improve sales strategies.
For example, analysis may reveal that a particular customer segment has strong repeat-purchase behavior. The business could then develop targeted campaigns or loyalty initiatives for that segment.
6. Cost Reduction
Analytics is not only about increasing revenue. It can also help organizations identify unnecessary expenses.
Businesses can analyze operational costs, inventory waste, inefficient processes, resource utilization, and supplier performance.
Reducing avoidable costs can improve overall profitability.
7. Faster Identification of Business Problems
Real-time or regularly updated dashboards can help organizations identify performance problems earlier.
For example, if website conversions suddenly decline, a dashboard can highlight the change quickly. Teams can then investigate the cause instead of discovering the issue weeks later.
Timely information can help businesses respond more effectively to changing conditions.
The Importance of KPIs in Analytics & Reporting
Key Performance Indicators, commonly known as KPIs, are measurable values used to track progress toward specific business objectives.
Different organizations and departments require different KPIs.
For example:
Sales KPIs
- Revenue
- Sales growth
- Conversion rate
- Average order value
- Customer retention
Marketing KPIs
- Leads
- Website traffic
- Conversion rate
- Cost per acquisition
- Campaign ROI
Customer Service KPIs
- Response time
- Resolution time
- Customer satisfaction
- Ticket volume
Operations KPIs
- Productivity
- Delivery time
- Inventory turnover
- Operational costs
Selecting relevant KPIs helps organizations focus on information that directly supports their goals.
Dashboards: Turning Complex Data Into Clear Insights
Business dashboards have become an important component of modern analytics.
A dashboard combines important metrics and visualizations into a single interface. Instead of reviewing multiple spreadsheets and reports, users can monitor key information from one centralized location.
An effective dashboard should be:
- Easy to understand
- Focused on important metrics
- Visually organized
- Updated regularly
- Relevant to the target audience
- Designed around business objectives
Different stakeholders may require different dashboards. A CEO may need a high-level business overview, while a marketing manager may need detailed campaign performance data.
The Role of Data Visualization
Data visualization makes complex information easier to interpret.
Common visualization methods include:
- Bar charts
- Line charts
- Pie charts
- Area charts
- Scatter plots
- Heatmaps
- KPI cards
- Geographic maps
- Interactive dashboards
Choosing the right visualization is important. A visualization should make the intended message clearer rather than making the report unnecessarily complicated.
For example, line charts can be useful for showing changes over time, while bar charts can make category comparisons easier.
Analytics and Reporting in Different Industries
Analytics is not limited to one business sector. Organizations across industries use data to improve decision-making.
Retail
Retail businesses can analyze customer purchases, inventory, product performance, and seasonal trends.
Healthcare
Healthcare organizations can use analytics to study operational performance, resource utilization, patient service patterns, and administrative data while following applicable privacy and regulatory requirements.
Banking and Finance
Financial institutions can analyze transactions, customer behavior, risk indicators, and financial performance.
Education
Educational institutions can use analytics to monitor enrollment, student engagement, attendance, course performance, and institutional operations.
Manufacturing
Manufacturers can analyze production efficiency, equipment performance, inventory, quality metrics, and supply-chain information.
Digital Marketing
Marketing organizations can measure campaign performance, website behavior, search visibility, customer acquisition, and conversion trends.
This wide range of applications demonstrates how analytics can support decision-making across different business functions.
Common Challenges in Analytics & Reporting
Although analytics offers significant opportunities, organizations may also face several challenges.
Poor Data Quality
Incorrect or incomplete data can produce misleading insights. Establishing data-quality processes is therefore essential.
Data Silos
When departments store information in disconnected systems, it can become difficult to create a complete view of business performance.
Too Many Metrics
Tracking hundreds of metrics does not necessarily improve decision-making. Businesses should prioritize KPIs that directly relate to their objectives.
Lack of Data Skills
Organizations need professionals who understand data preparation, analysis, visualization, reporting, and business communication.
Misinterpreting Data
Data requires context. A correlation between two variables does not automatically mean that one caused the other. Analysts must carefully evaluate the information before drawing conclusions.
Building a Strong Analytics Culture
Technology alone cannot create a data-driven organization. Businesses also need a culture that encourages teams to use evidence when making decisions.
A strong analytics culture includes:
- Clearly defined business objectives
- Reliable data sources
- Consistent reporting standards
- Accessible dashboards
- Data literacy across teams
- Continuous performance monitoring
- Collaboration between business and analytics teams
When employees understand how to interpret and use data, analytics becomes part of everyday decision-making rather than a separate reporting activity.
Skills Needed for an Analytics & Reporting Career
The growing importance of data has increased demand for professionals with analytics and reporting skills.
Important skills include:
- Excel and spreadsheet analysis
- SQL
- Data cleaning
- Statistical concepts
- Data visualization
- Dashboard development
- Business intelligence
- Reporting
- Problem-solving
- Communication
- Business understanding
Knowledge of tools such as Power BI, Tableau, Excel, SQL, and Python can also help professionals work with different types of analytics projects.
Technical skills are important, but the ability to communicate insights clearly is equally valuable. An analyst should be able to explain not only what the data shows, but also why it matters to the business.
The Future of Analytics & Reporting
Analytics is continuing to evolve as businesses adopt cloud platforms, automation, artificial intelligence, and advanced data technologies.
Modern analytics environments increasingly support:
- Automated reporting
- Real-time dashboards
- AI-assisted insights
- Predictive analytics
- Natural-language data queries
- Automated anomaly detection
- Advanced forecasting
- Self-service business intelligence
These technologies can reduce the time required to find and interpret information. However, human judgment remains important because business decisions require context, objectives, ethics, and an understanding of real-world conditions.
From Data to Decisions: The Complete Business Journey
The journey from data to business growth can be viewed as a continuous process:
Data → Cleaning → Analysis → Visualization → Insights → Decisions → Action → Measurement → Improvement
Each stage contributes to the next.
Collecting data without analyzing it creates limited value. Analyzing data without communicating the findings can make insights difficult to use. Reporting without action may not create meaningful business impact.
The greatest value comes when organizations connect analytics and reporting with actual business objectives and continuously measure the results of their decisions.
Final Thoughts
In a data-driven economy, businesses need more than large volumes of information. They need the ability to transform information into meaningful insights and meaningful insights into effective action.
Analytics & Reporting provide the foundation for this transformation. They help organizations understand performance, identify opportunities, recognize challenges, improve customer experiences, optimize operations, and support strategic planning.
For professionals, developing analytics and reporting skills can open opportunities across industries because businesses increasingly depend on people who can work with data and communicate insights effectively.
Explore Our Courses
Ready to master the skills discussed in this article? Check out our comprehensive course programs designed by industry experts.
Browse Courses →Explore Our Services
Looking to implement these concepts in your organization? Our services team can help you achieve your business goals.
View Services →



Comments
No comments yet. Be the first to comment!